
Your city budget is a political document
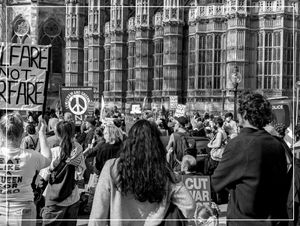
Few topics generate more political heat than the budget. At the federal level, spending fights have become a recurring crisis, with government shutdowns growing more frequent and more prolonged. But for most Americans, the budget that shapes daily life most directly is not in Washington. It is the one passed each year by their city council, allocating dollars to schools, roads, parks, and public health. These decisions are less visible than congressional standoffs, but their effects are immediate: the condition of your neighborhood park, the staffing level at your fire station, and the quality of your local public school all trace back to choices made in a city budget.
This analysis examines how 150 large American cities allocated their general spending in 2023, using fiscal data from the Lincoln Institute of Land Policy's Fiscally Standardized Cities database. The FiSC database standardizes spending across cities by consolidating overlapping government layers, making cross-city comparisons possible in a way that raw budget documents do not allow. General spending excludes utilities and liquor store operations, focusing on the core services cities provide to residents.
The picture that emerges is one of structured variation. Cities are not random in how they spend. Predictable forces, rooted in demography, geography, and political structure, explain a meaningful share of the differences between them.
Where the money goes
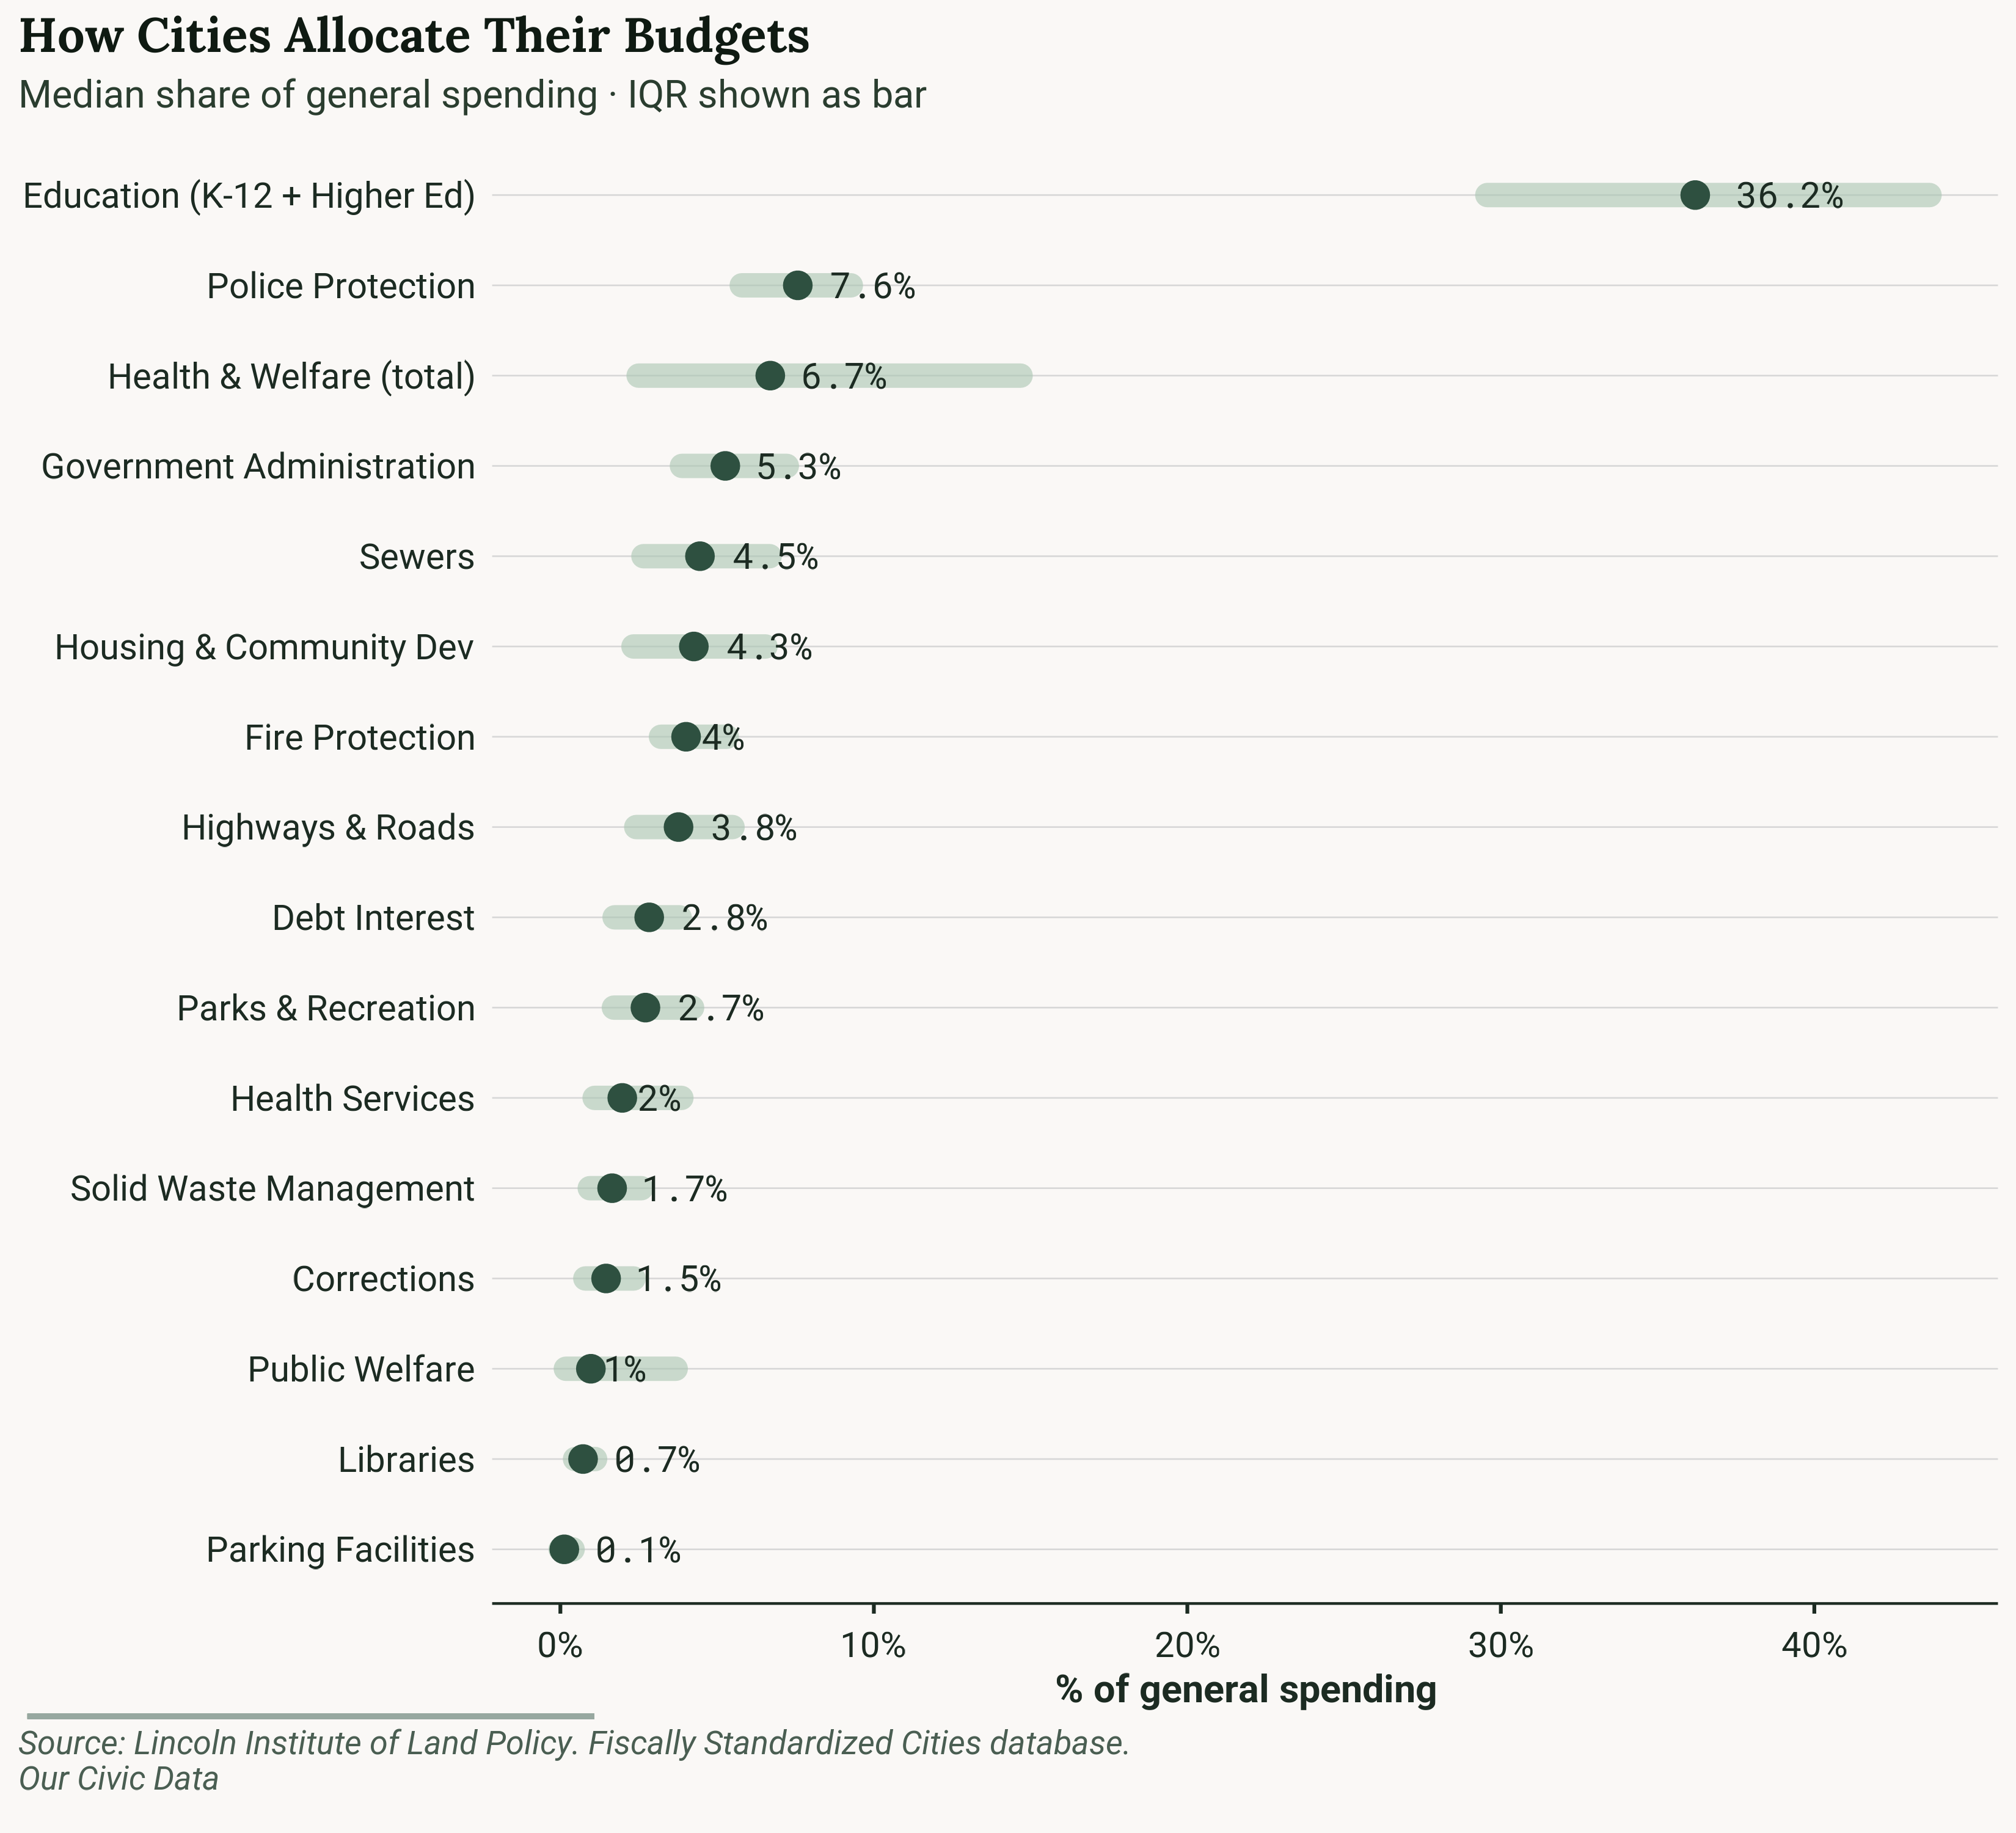
Education consumes the largest share of city budgets by a wide margin. Across the 150 cities in this sample, the median city devotes roughly 36% of its general spending to education. Police protection is a distant second at around 8%, followed by health and welfare at 7%, general administration at 5%, and sewers at 4.5%. Parks, fire protection, highways, and housing each claim between 3 and 5% of the median budget. Debt interest, libraries, corrections, and parking round out the picture at smaller shares.
But medians obscure as much as they reveal. Education and health and welfare are not only the largest categories — they are also the most variable. Springfield, Massachusetts devotes 68.6% of its budget to education. Gulfport, Mississippi directs 71.3% of its budget to health and welfare. At the other end, some cities spend less than 10% on education and essentially nothing on health and welfare.
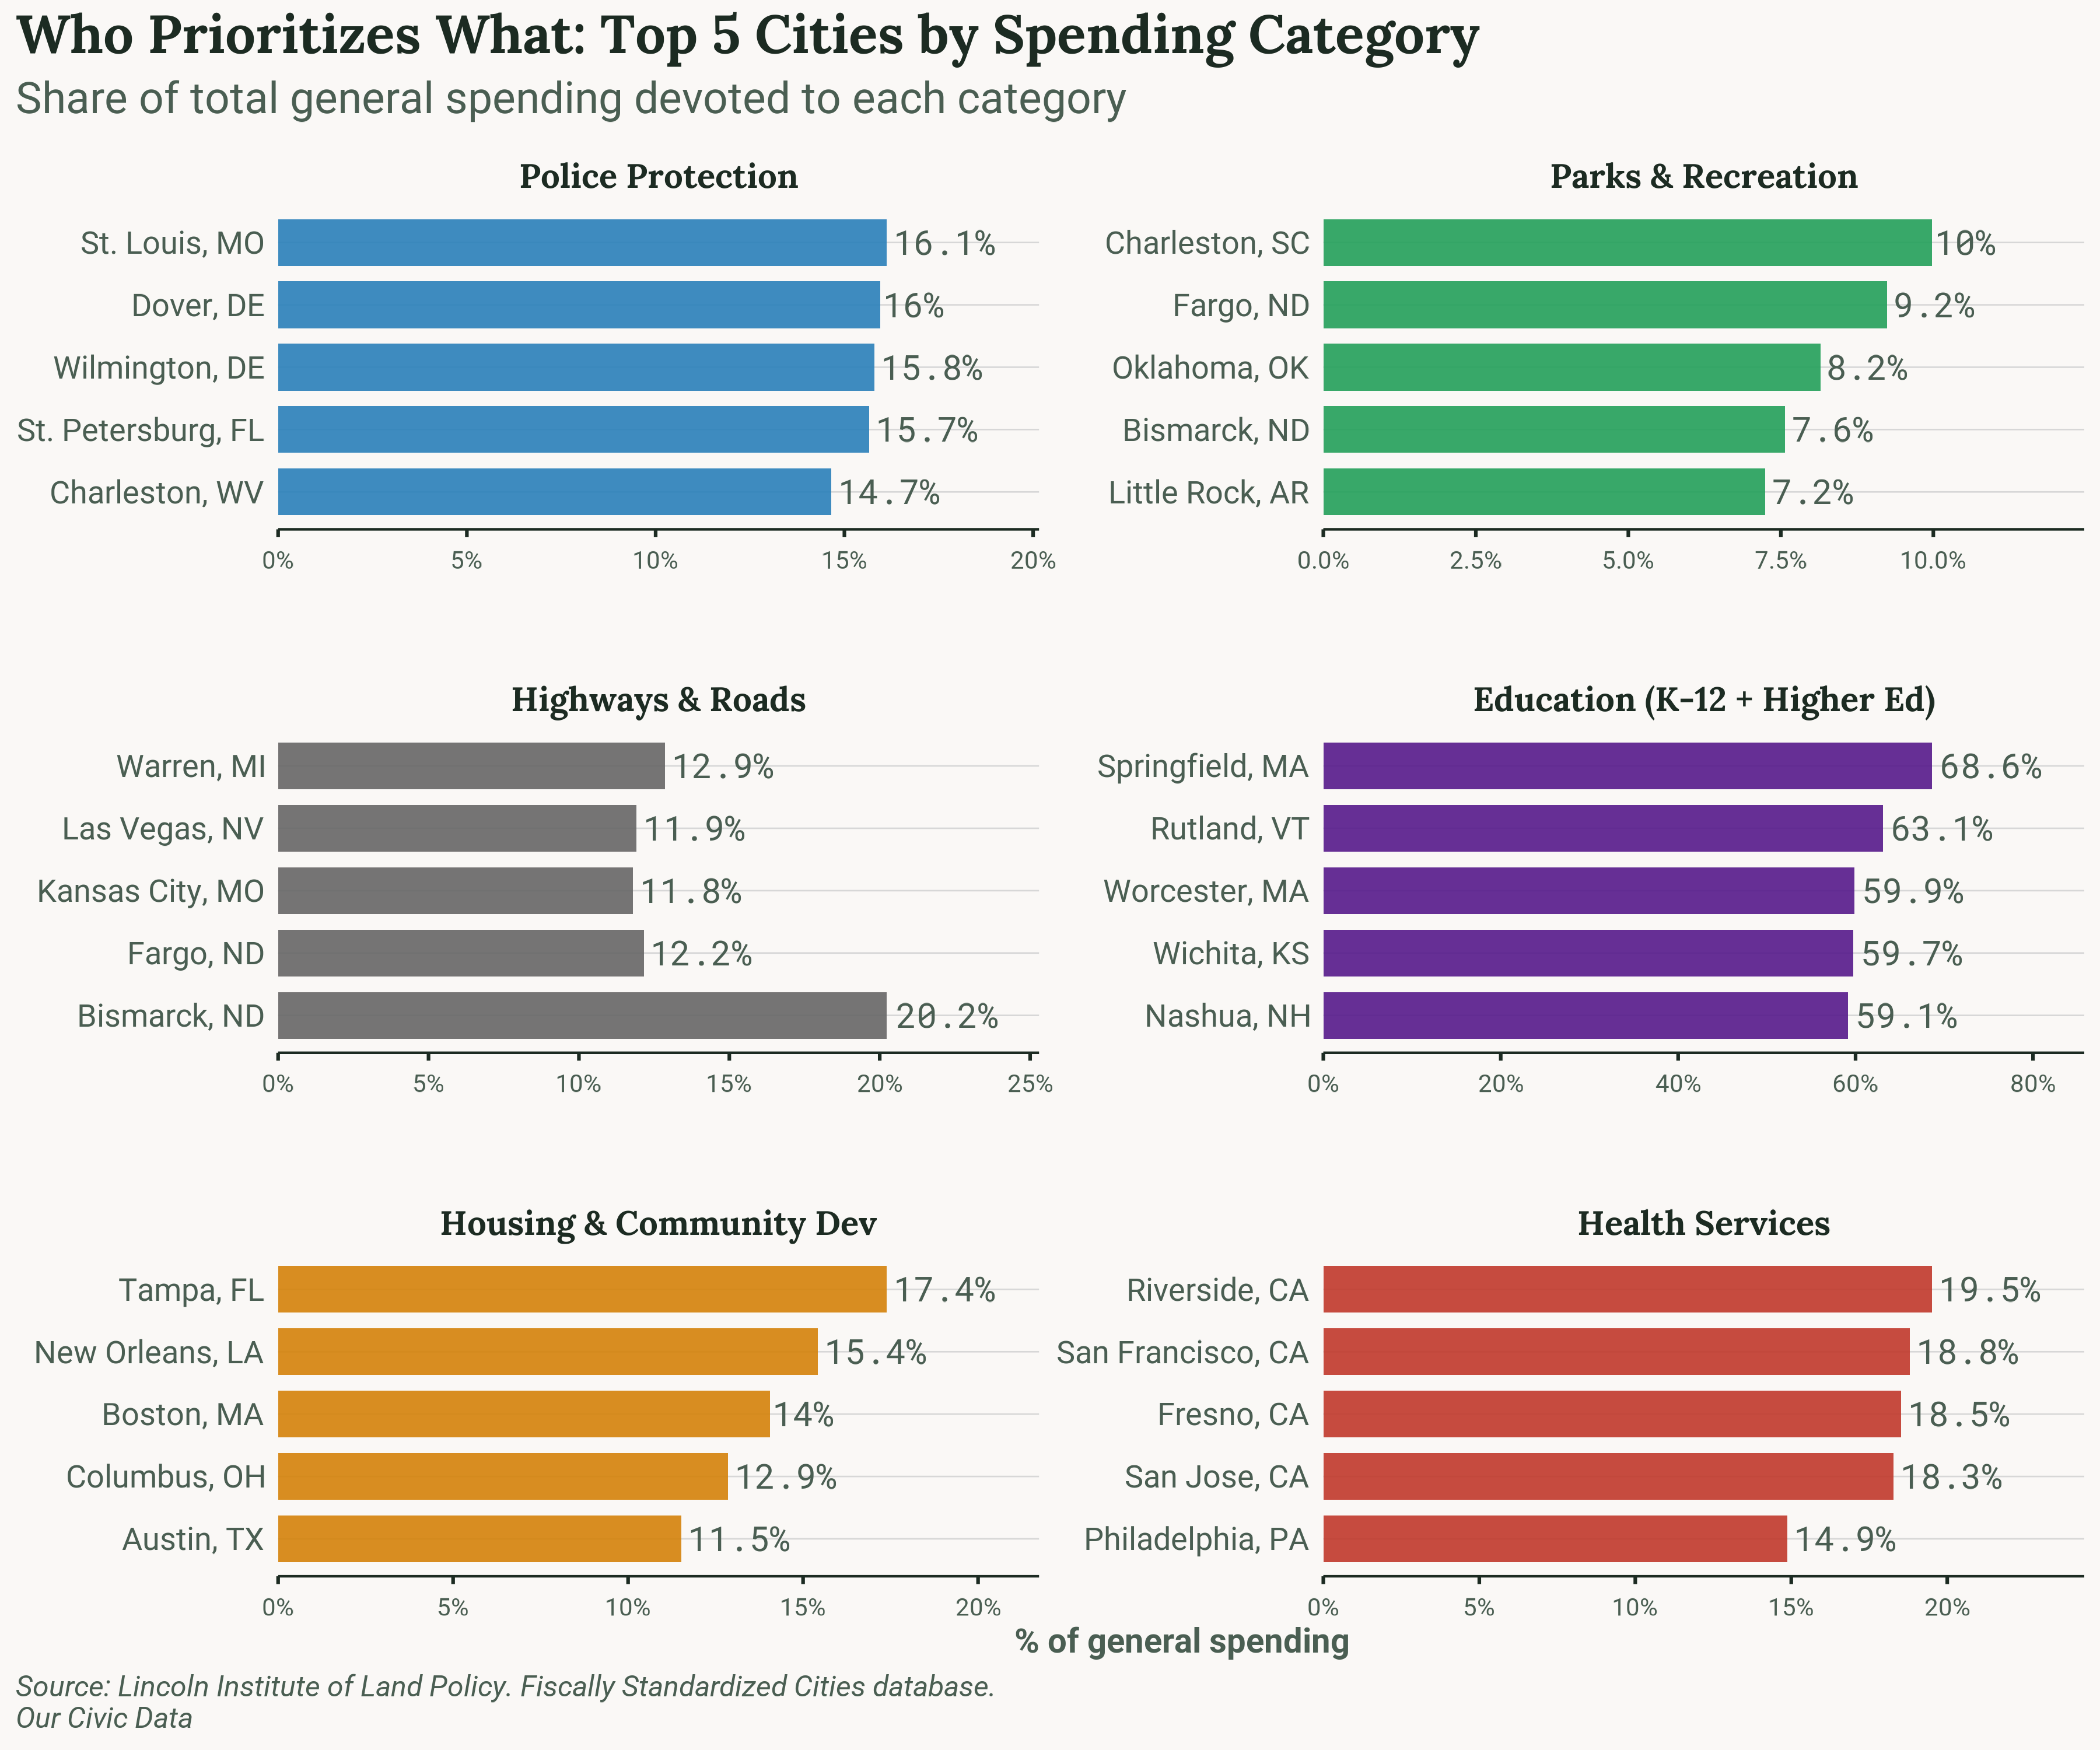
Education dominates city budgets, consuming the largest share of general spending across nearly all cities in the sample. Yet it is also where cities diverge most sharply from one another. Health and welfare spending shows similarly wide variation. A city's demographic composition, its regional context, and the partisan structure of its state government each play a meaningful role.
Education
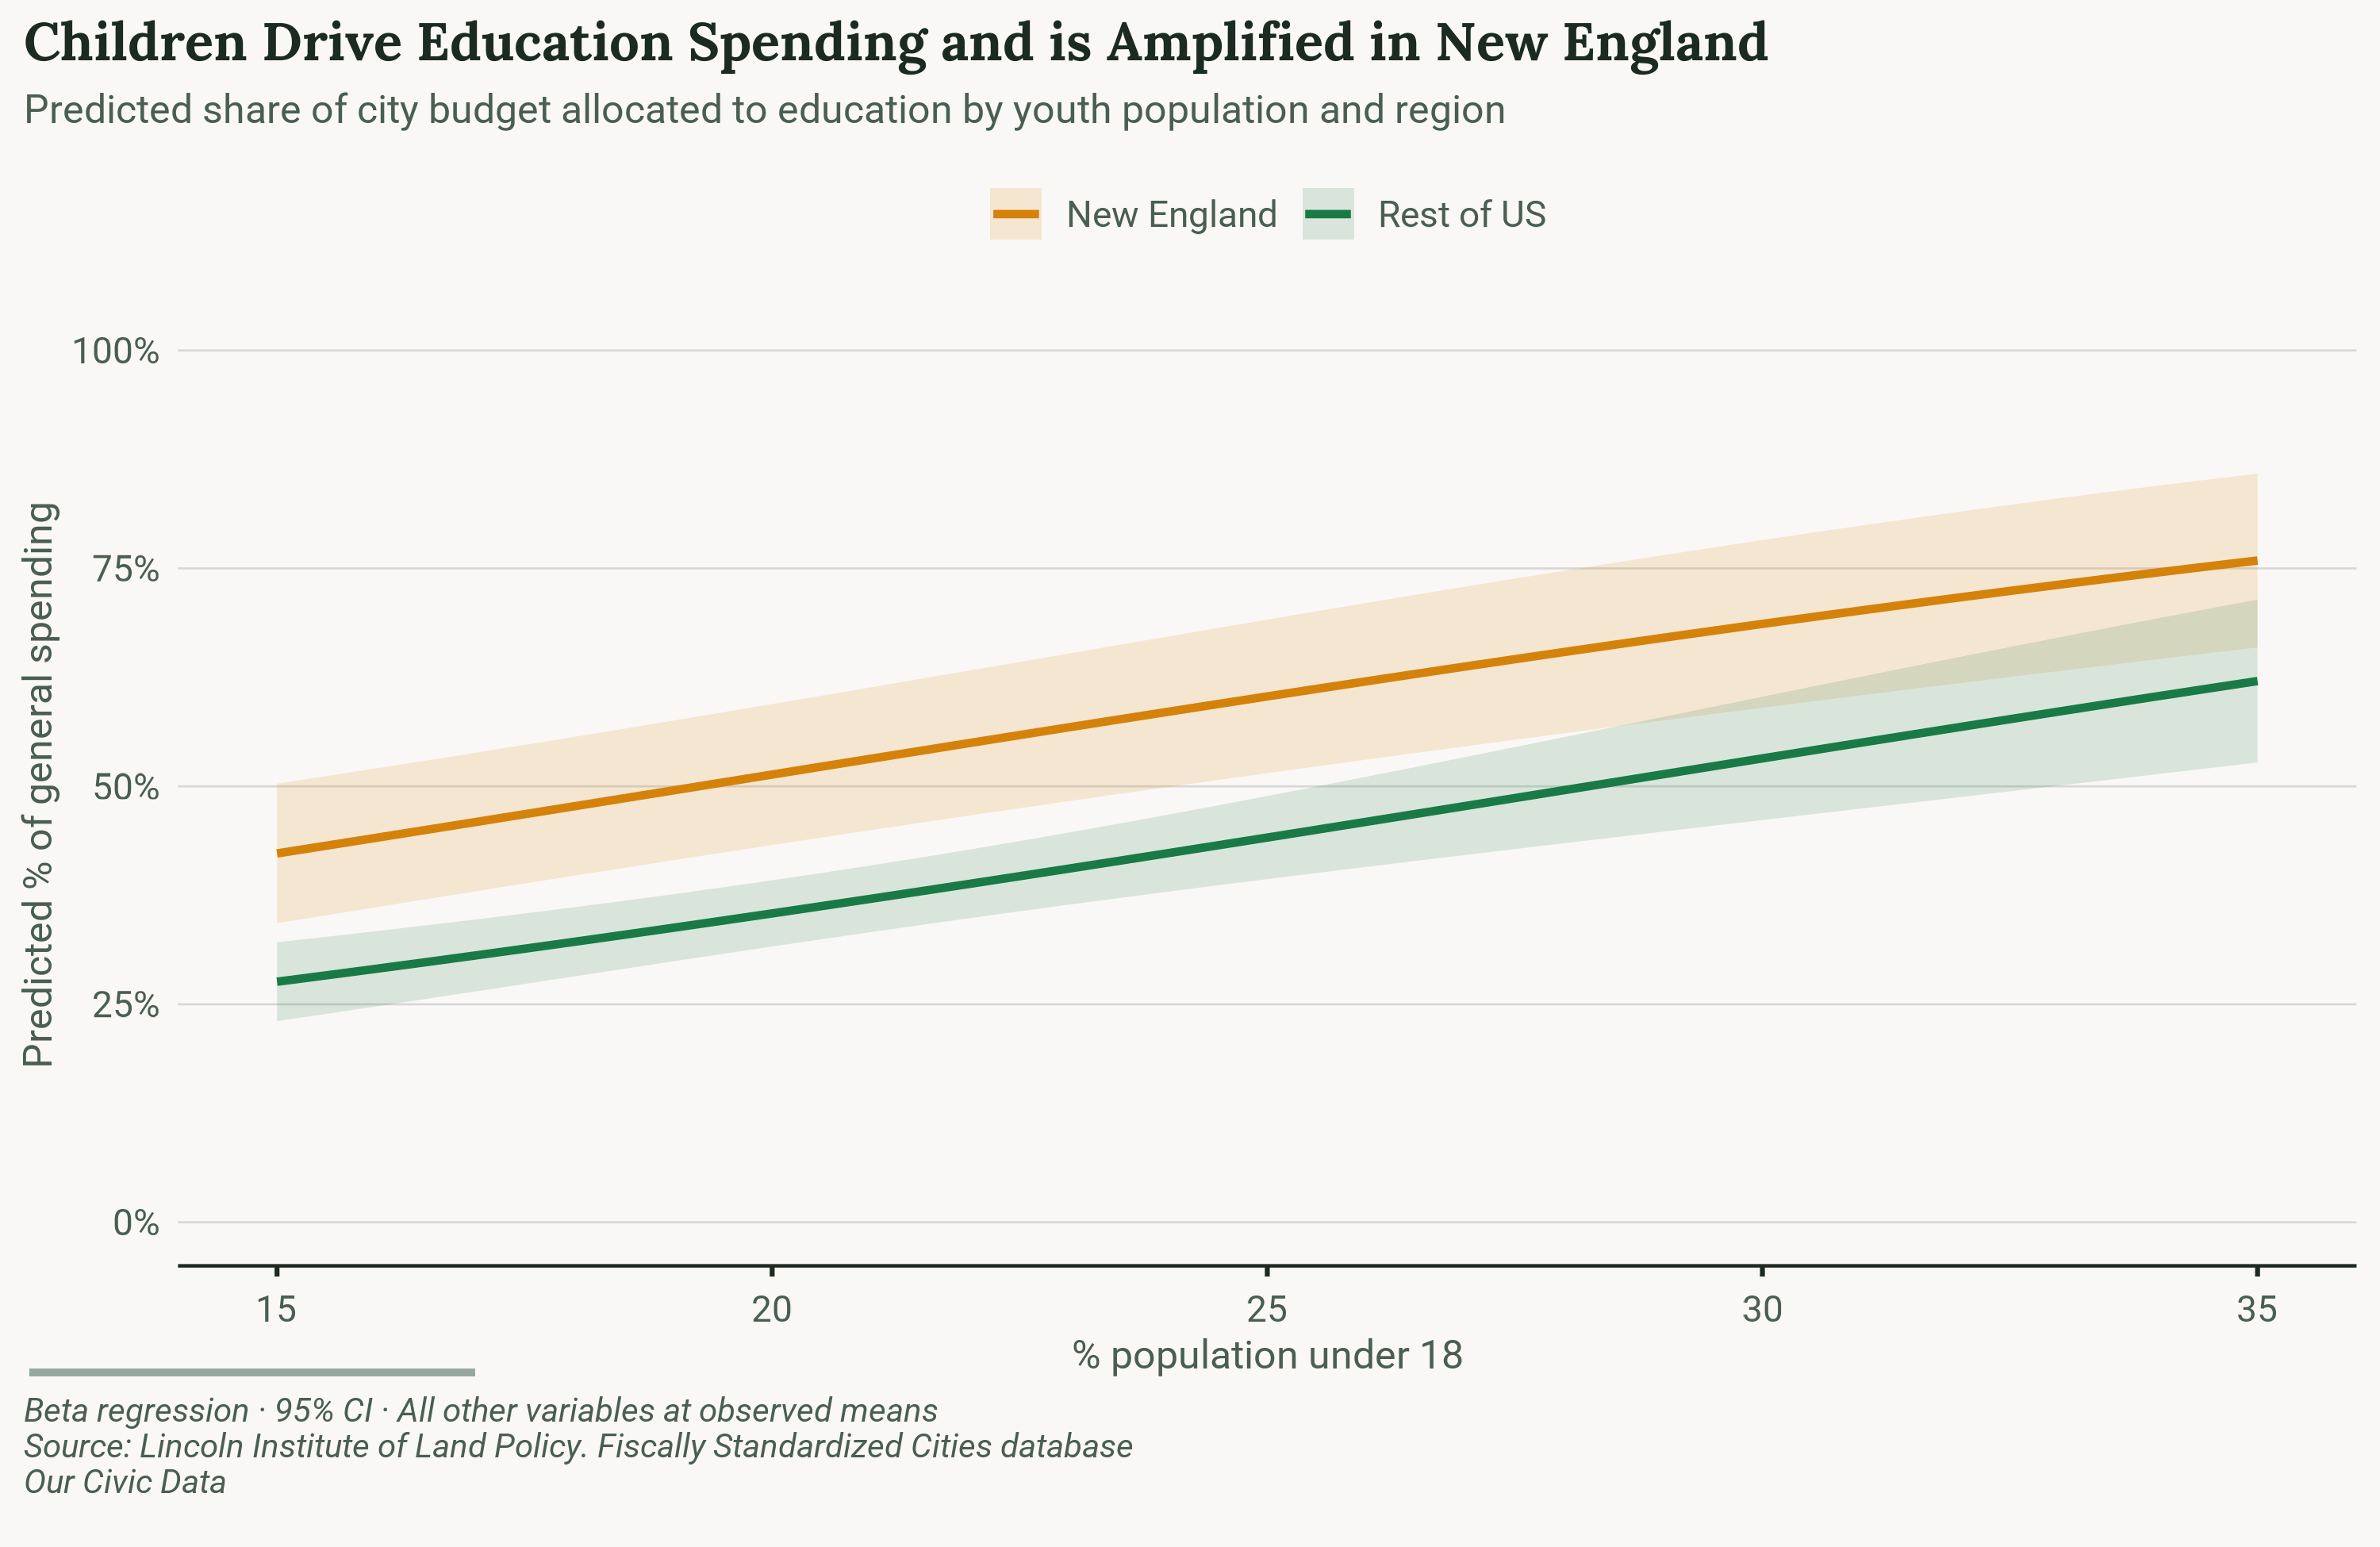
As expected, the age composition of a city's population shapes its education budget. Each one percentage point increase in the share of residents under the age of 18 is associated with a 1.65 percentage point increase in the education share of the city budget, after accounting for income, race, region, and political environment. Cities built around families spend more on schools. This is not surprising, but the magnitude is worth noting: the difference between a city where 15 percent of residents are under 18 and one where 30 percent are is, on average, a roughly 25 percentage point difference in the education budget share.
Region matters as well, and to a greater degree. New England cities allocate roughly 15 to 16 percentage points more of their budgets to education compared to cities elsewhere in the country. This reflects a longstanding regional tradition of strong local investment in public education, rooted in the town meeting model of governance and New England's historical reliance on local property taxes to fund schools. It is worth noting that this regional effect operates independently of whether a city has a city-run school district. Within New England, cities with independent school districts spend nearly as much as those where schools are formally part of the city government.
Cities with larger Black populations allocate a smaller share of their budgets to education, a pattern that persists after controlling for income, region, and political environment. The magnitude is modest, roughly 0.14 percentage points per one percentage point increase in Black population share, but statistically reliable. The mechanisms behind this finding are not identified in this data alone and warrant careful interpretation. It may reflect historical patterns of school funding inequity, differences in municipal fiscal capacity, or variation in how education dollars flow through city versus county budgets in cities with large Black populations concentrated in the South.
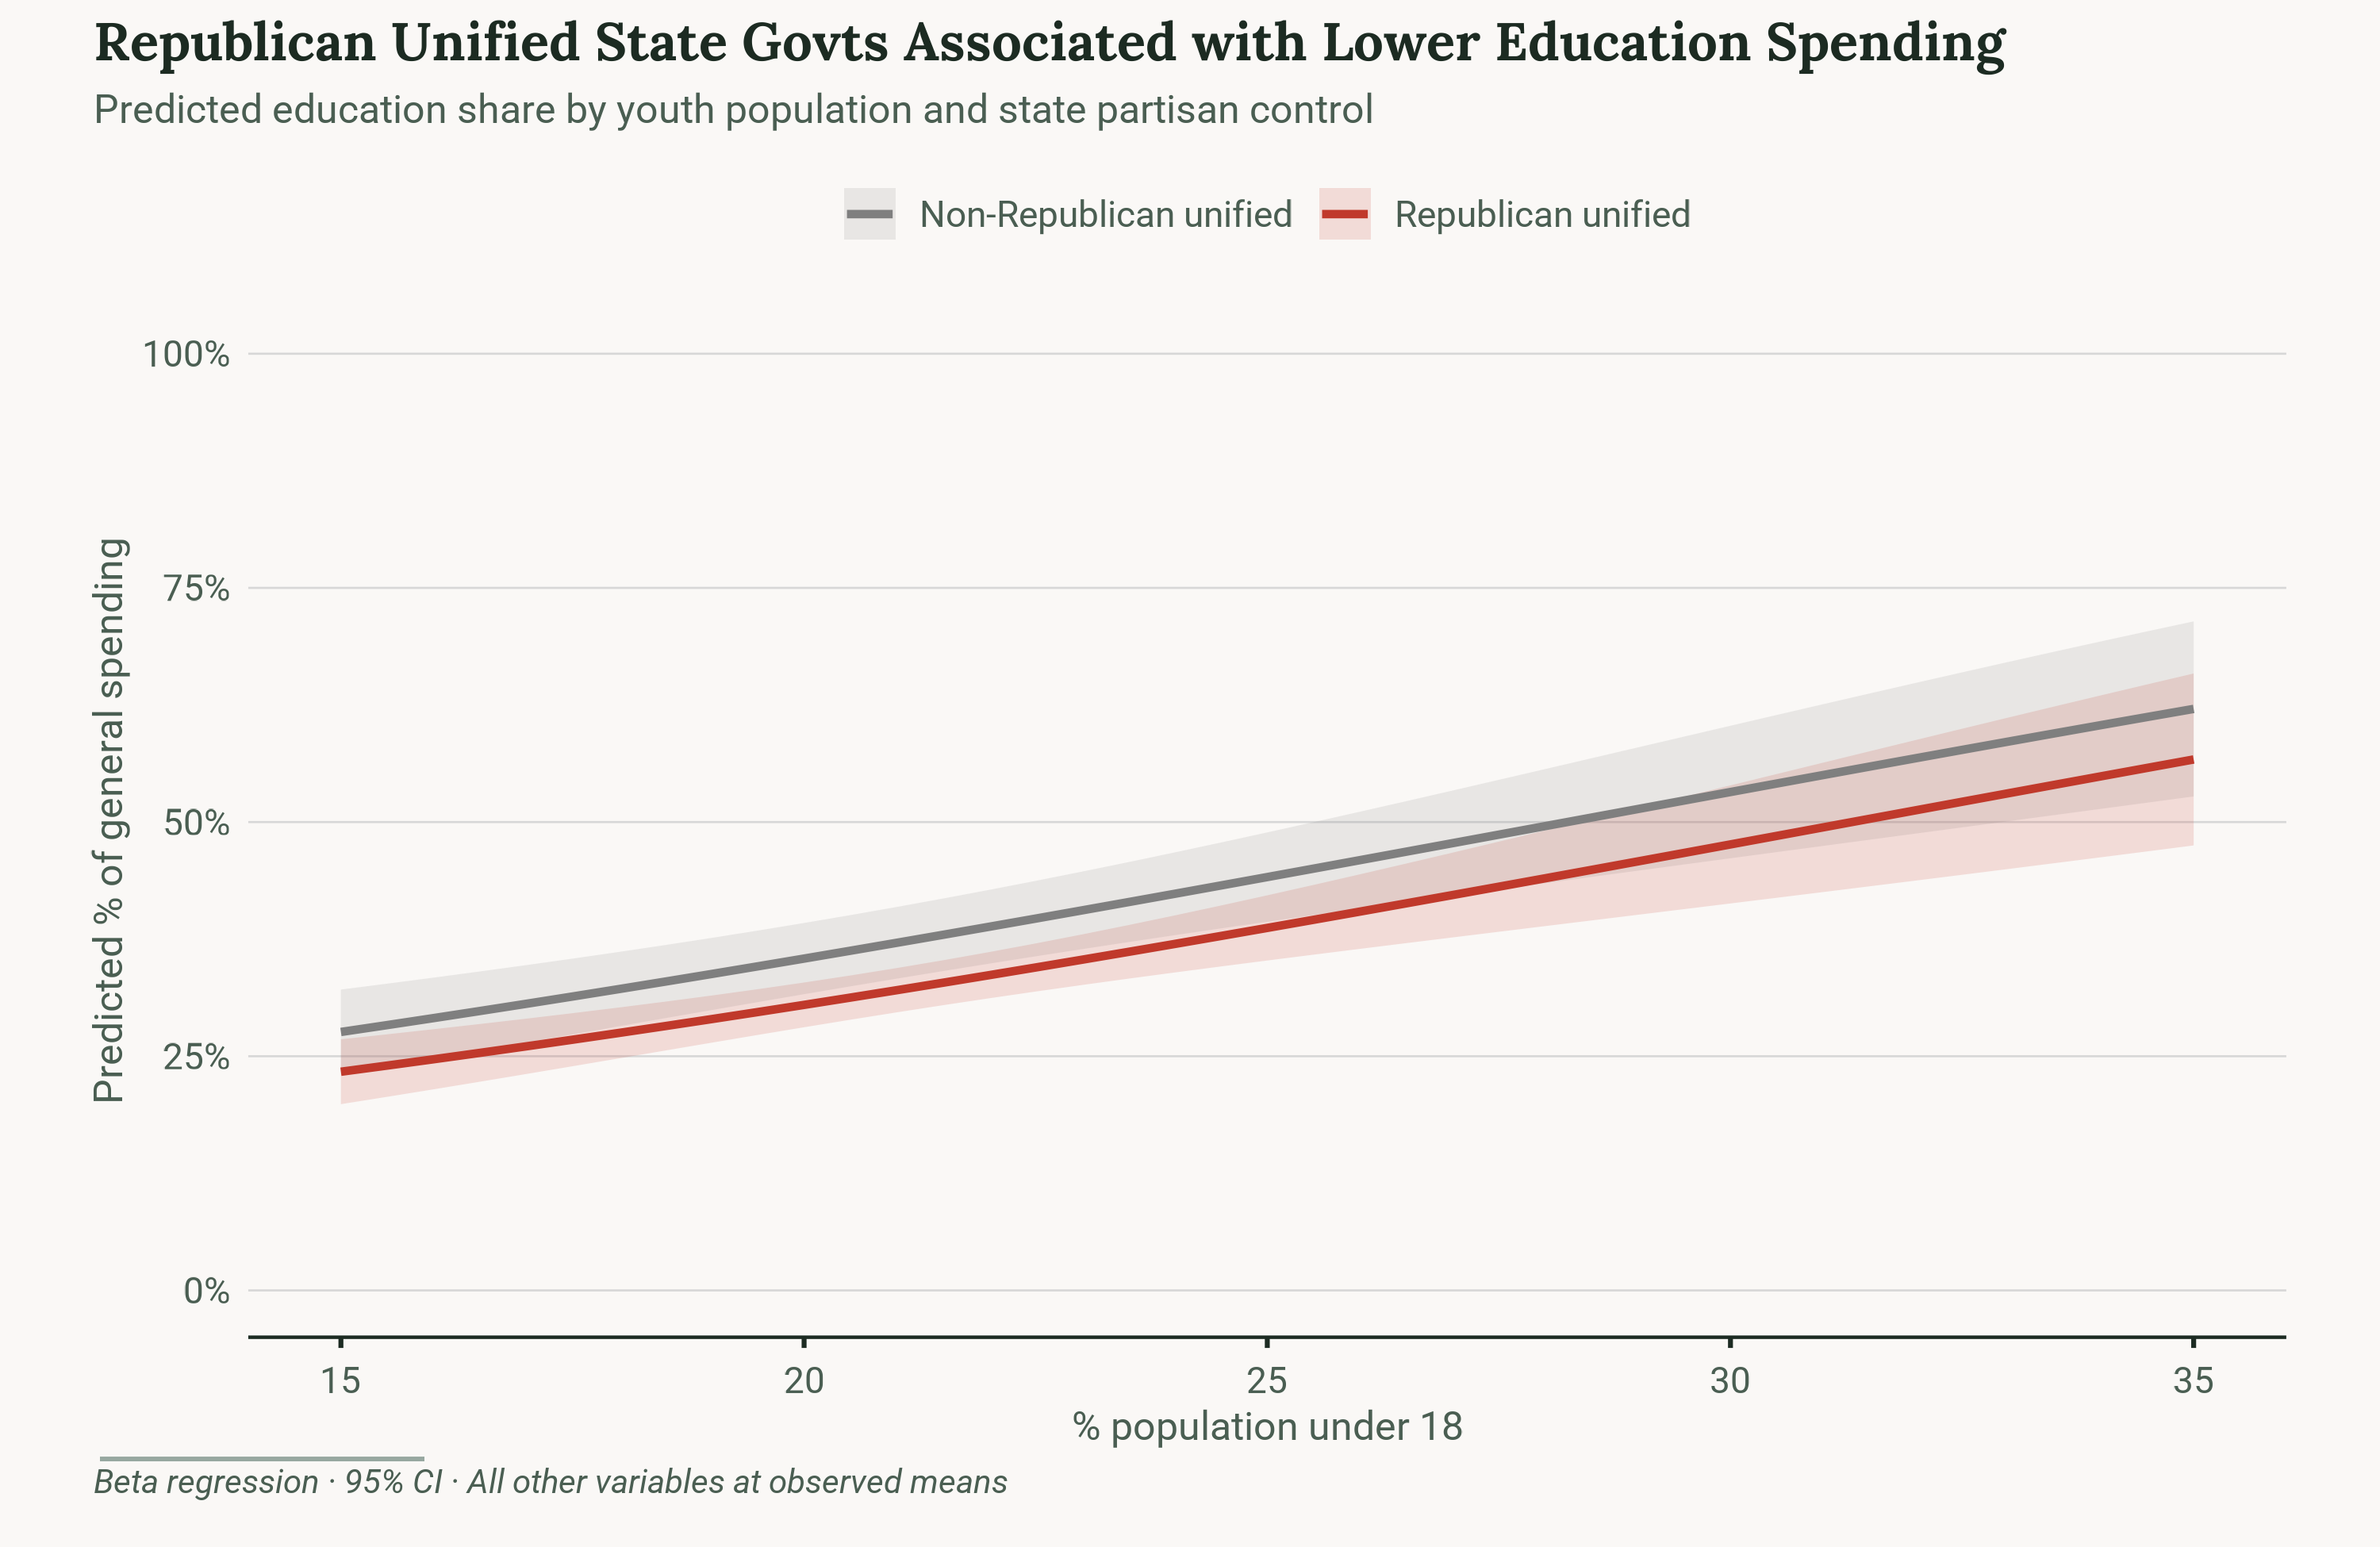
The political composition of the state matters too. Cities in states with unified Republican governments, where the GOP controls both legislative chambers and the governorship, spend approximately five percentage points less on education than cities in states with divided governments or Democratic control. This effect is independent of region, population density, income, and racial composition. It is worth being precise about what this finding does and does not say. It does not mean Republican-controlled cities spend less on education — the unit of analysis here is the state government, not the city government. A Democratic-majority city in a Republican-unified state still shows this reduced education share, suggesting that state-level policy decisions about school funding formulas, aid distribution, and local taxing authority shape city budgets even when the city itself leans the other direction.
One variable that does not predict education spending, once these factors are controlled for, is how much revenue the city raises locally. The share of school district revenue coming from local sources, as opposed to state and federal funds, is statistically flat in the model. This may seem counterintuitive, but it reflects the passthrough nature of education spending in city budgets: cities in high-aid states route more state money through their budgets to schools, so total education spending rises with state aid rather than falling as one might expect.
Health & Welfare
Health and welfare spending tells a different story. Where education is shaped primarily by demography and regional culture, health and welfare spending is more sensitive to fiscal structure and state policy decisions.
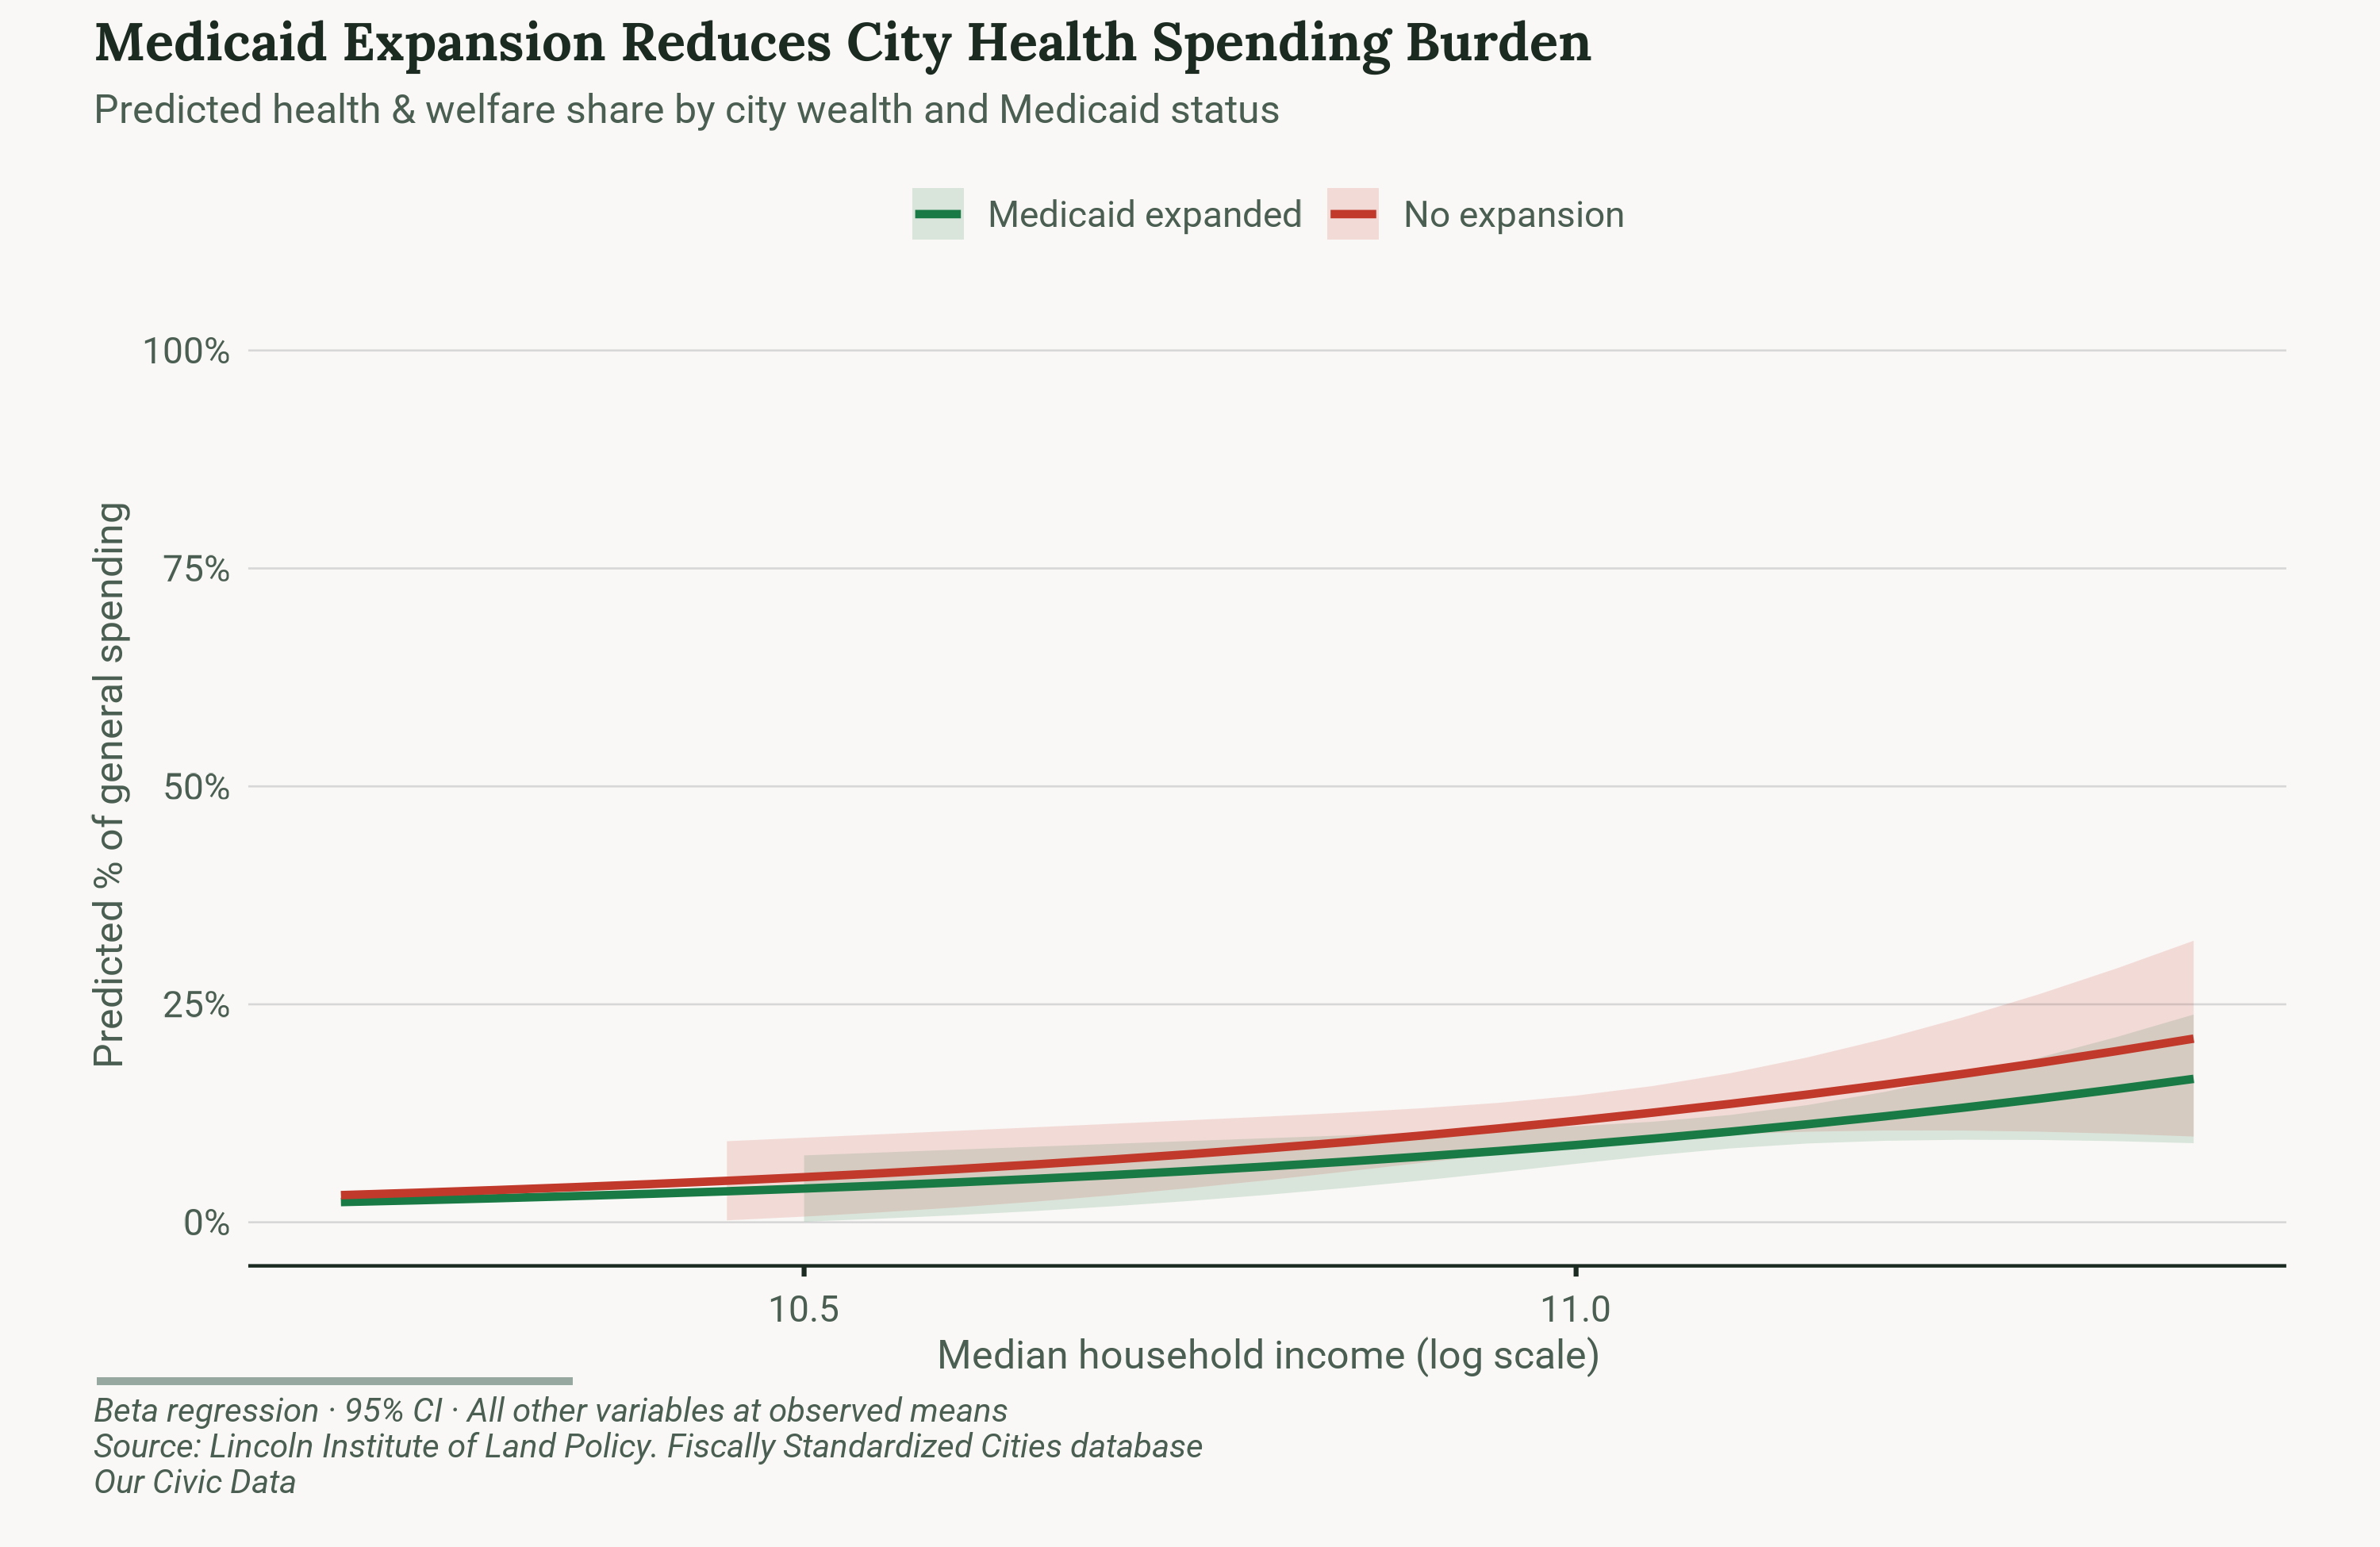
The single strongest predictor of a city's health and welfare spending share is whether its state expanded Medicaid under the Affordable Care Act. Cities in Medicaid expansion states spend approximately three percentage points less on health and welfare than cities in non-expansion states, after controlling for demographics, income, and population size. This finding reflects a real fiscal mechanism: when states expand Medicaid, they draw down federal dollars to cover low-income residents who would otherwise rely on city-funded health programs. The burden shifts up the governmental ladder, and city budgets reflect the relief.
Wealthier cities spend more on health and welfare, not less. Each unit increase in log median household income is associated with roughly 17 percentage points more health and welfare spending. This is counterintuitive at first glance, but it makes sense on reflection. Wealthy cities have more fiscal capacity and tend to fund optional health programs, mental health services, and community health initiatives that poorer cities simply cannot afford. Health and welfare spending in this context is partly a luxury good at the city level, accessible to cities with sufficient revenue to go beyond the minimum.
City size also matters. Larger cities spend more on health and welfare as a share of their budgets, independent of income and demographics. This likely reflects the concentration of unhoused populations, substance use services, and public health infrastructure in large urban centers, as well as the greater political visibility of health needs in dense cities.
Consolidated city-county governments, those where city and county functions have been merged under a single government, spend less on health and welfare as a share of their budgets than standard municipalities. This may seem puzzling given that consolidated governments absorb county functions, which often include health departments and welfare administration. The likely explanation is that consolidated governments distribute health spending differently across budget categories, or that the consolidation itself reflects a historical context of leaner public services.
Notably, none of the public health burden measures included in this analysis, including diabetes prevalence, obesity rates, mental health days, and smoking rates, predict city health and welfare spending once fiscal and political structure is controlled for. Cities with sicker populations do not systematically spend more on health. The need, as measured by these indicators, does not drive the spending. The political and fiscal architecture of the state does. This is perhaps the most sobering finding in this analysis: the health of a city's residents is a weaker predictor of its health budget than the party controlling its statehouse.